Plotting basis function exponents
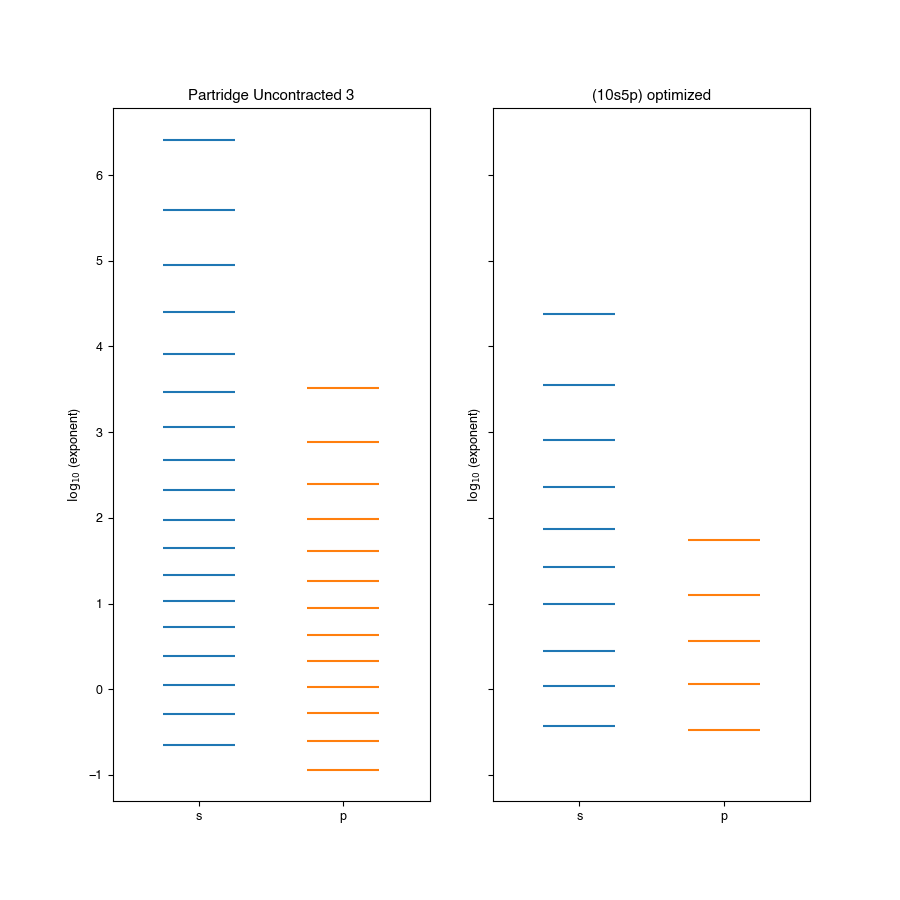
This tutorial demonstrates some of the visualization capabilities of BasisOpt, which relies on Matplotlib. In particular, we will use an event plot to compare the exponents for the Partridge Uncontracted 3 basis to the (10s5p) basis created in the Systematic removal of basis functions example. The full example script can be found in examples/reduce/viz_exponents.py.
This tutorial also demonstrates how a BasisOpt generated json file can be read in and used for further analysis.
Loading a basis from a json file
We begin by loading the json file generated during one of the previous tutorials. This file can be found in examples/reduce/neon-reduce.py.
ne = bo.read_json("neon-reduce.json")
We also fetch the Partridge Uncontracted 3 basis from the Basis Set Exchange.
from basisopt.bse_wrapper import fetch_basis
basis_name = 'Partridge Uncontracted 3'
start_basis = fetch_basis(basis_name, ['Ne'])
start_basis['partridge'] = start_basis['ne']
start_basis['optimized'] = ne.get_basis()['ne']
Visualization
We now generate the comparison between the starting Partridge Uncontracted 3 set and the (10s5p) basis that results from the reduction/optimization.
import matplotlib.pyplot as plt
from basisopt.viz.basis import plot_exponents
fig, ax = plot_exponents(start_basis, atoms=['partridge', 'optimized'], split_by_shell=True)
As the plots are Matplotlib objects, they can be adjusted using the standard syntax. Here we add some titles and output as a PNG.
ax[0].set_title('Partridge Uncontracted 3')
ax[1].set_title('(10s5p) optimized')
plt.savefig('basis_plot.png')
The resulting image is shown below.